Monitoring & Evaluation, simplified.

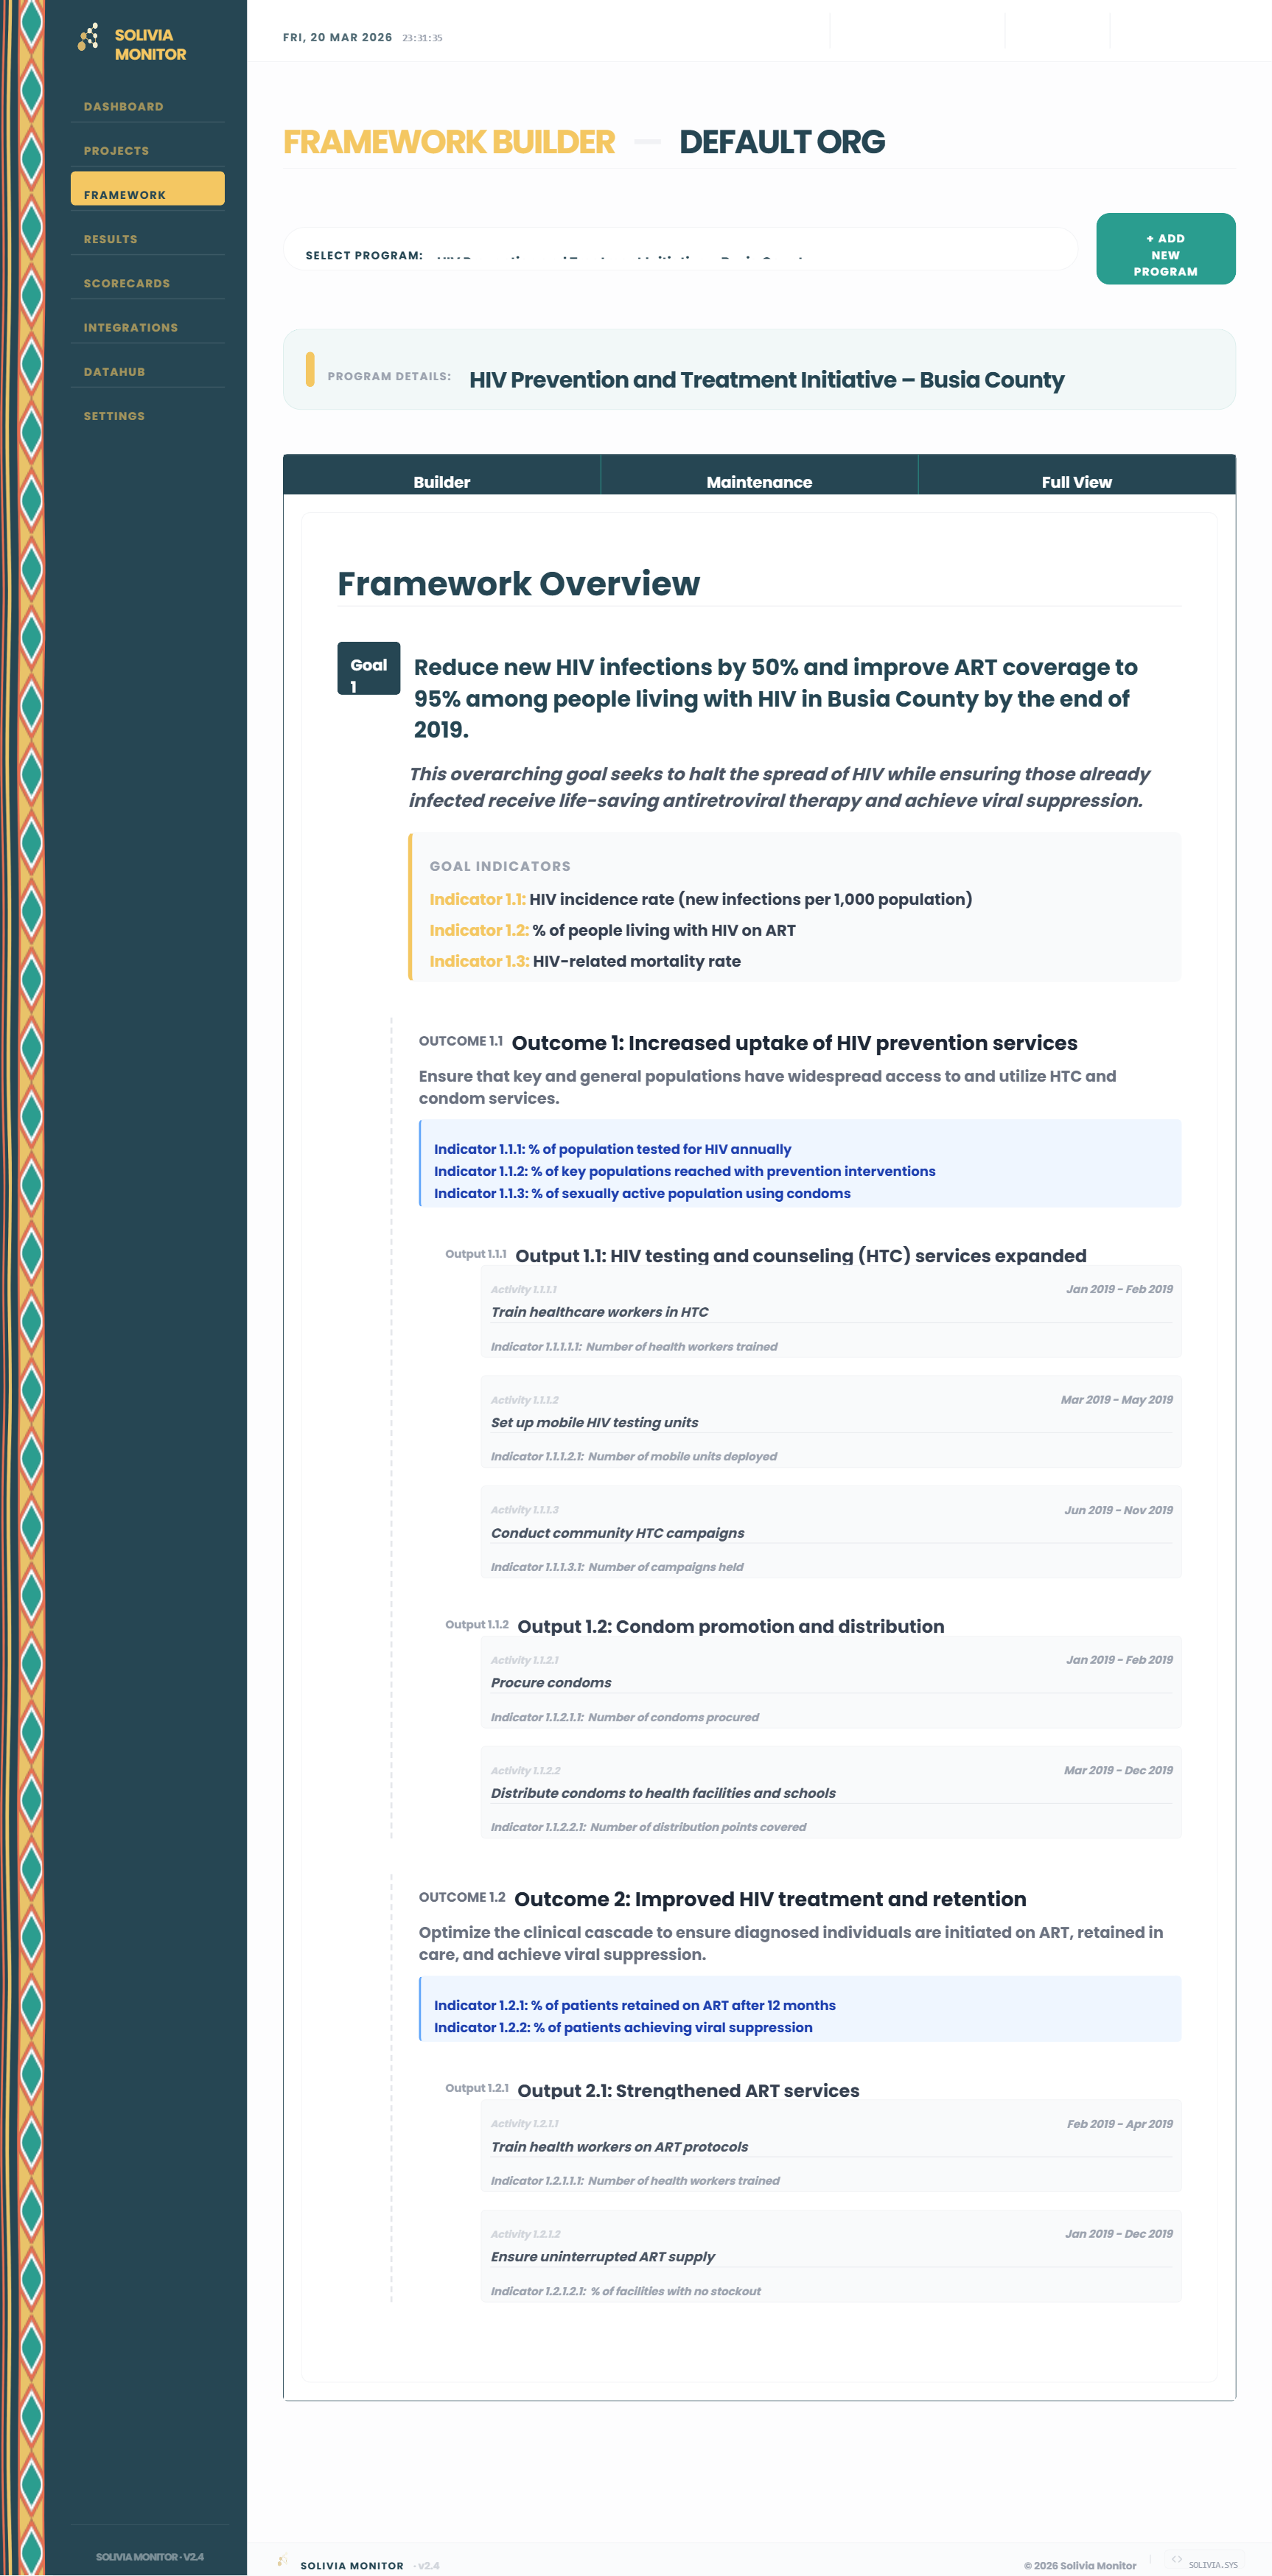
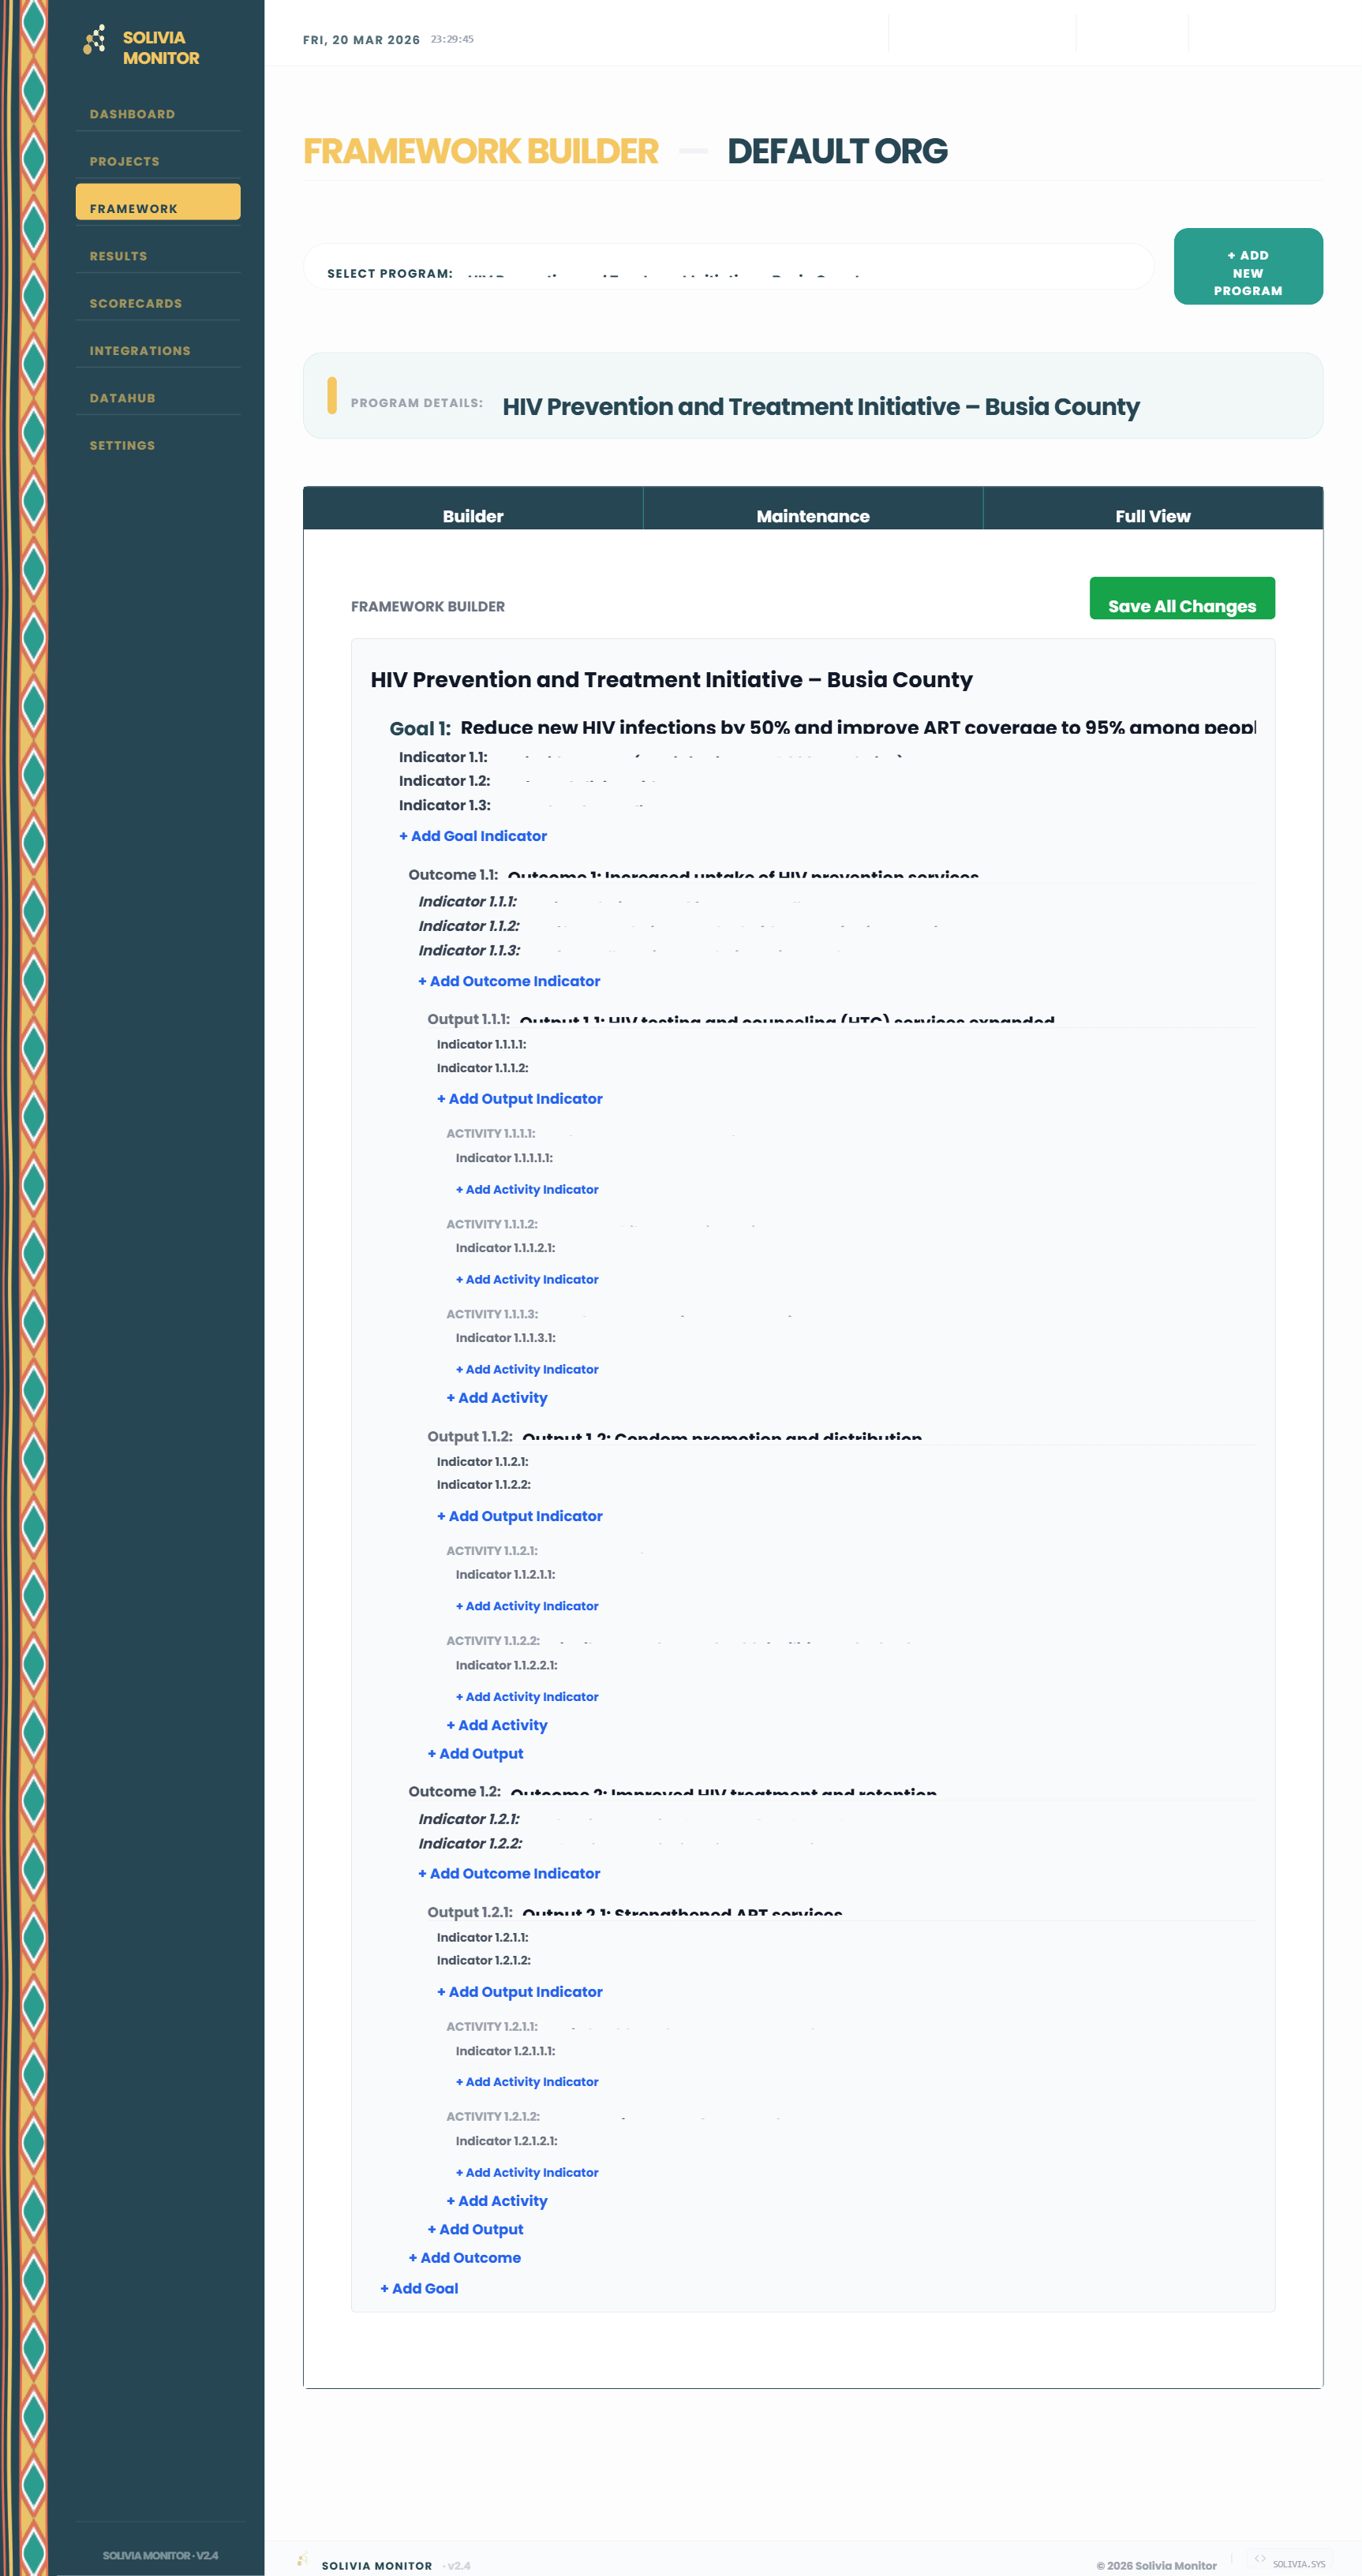
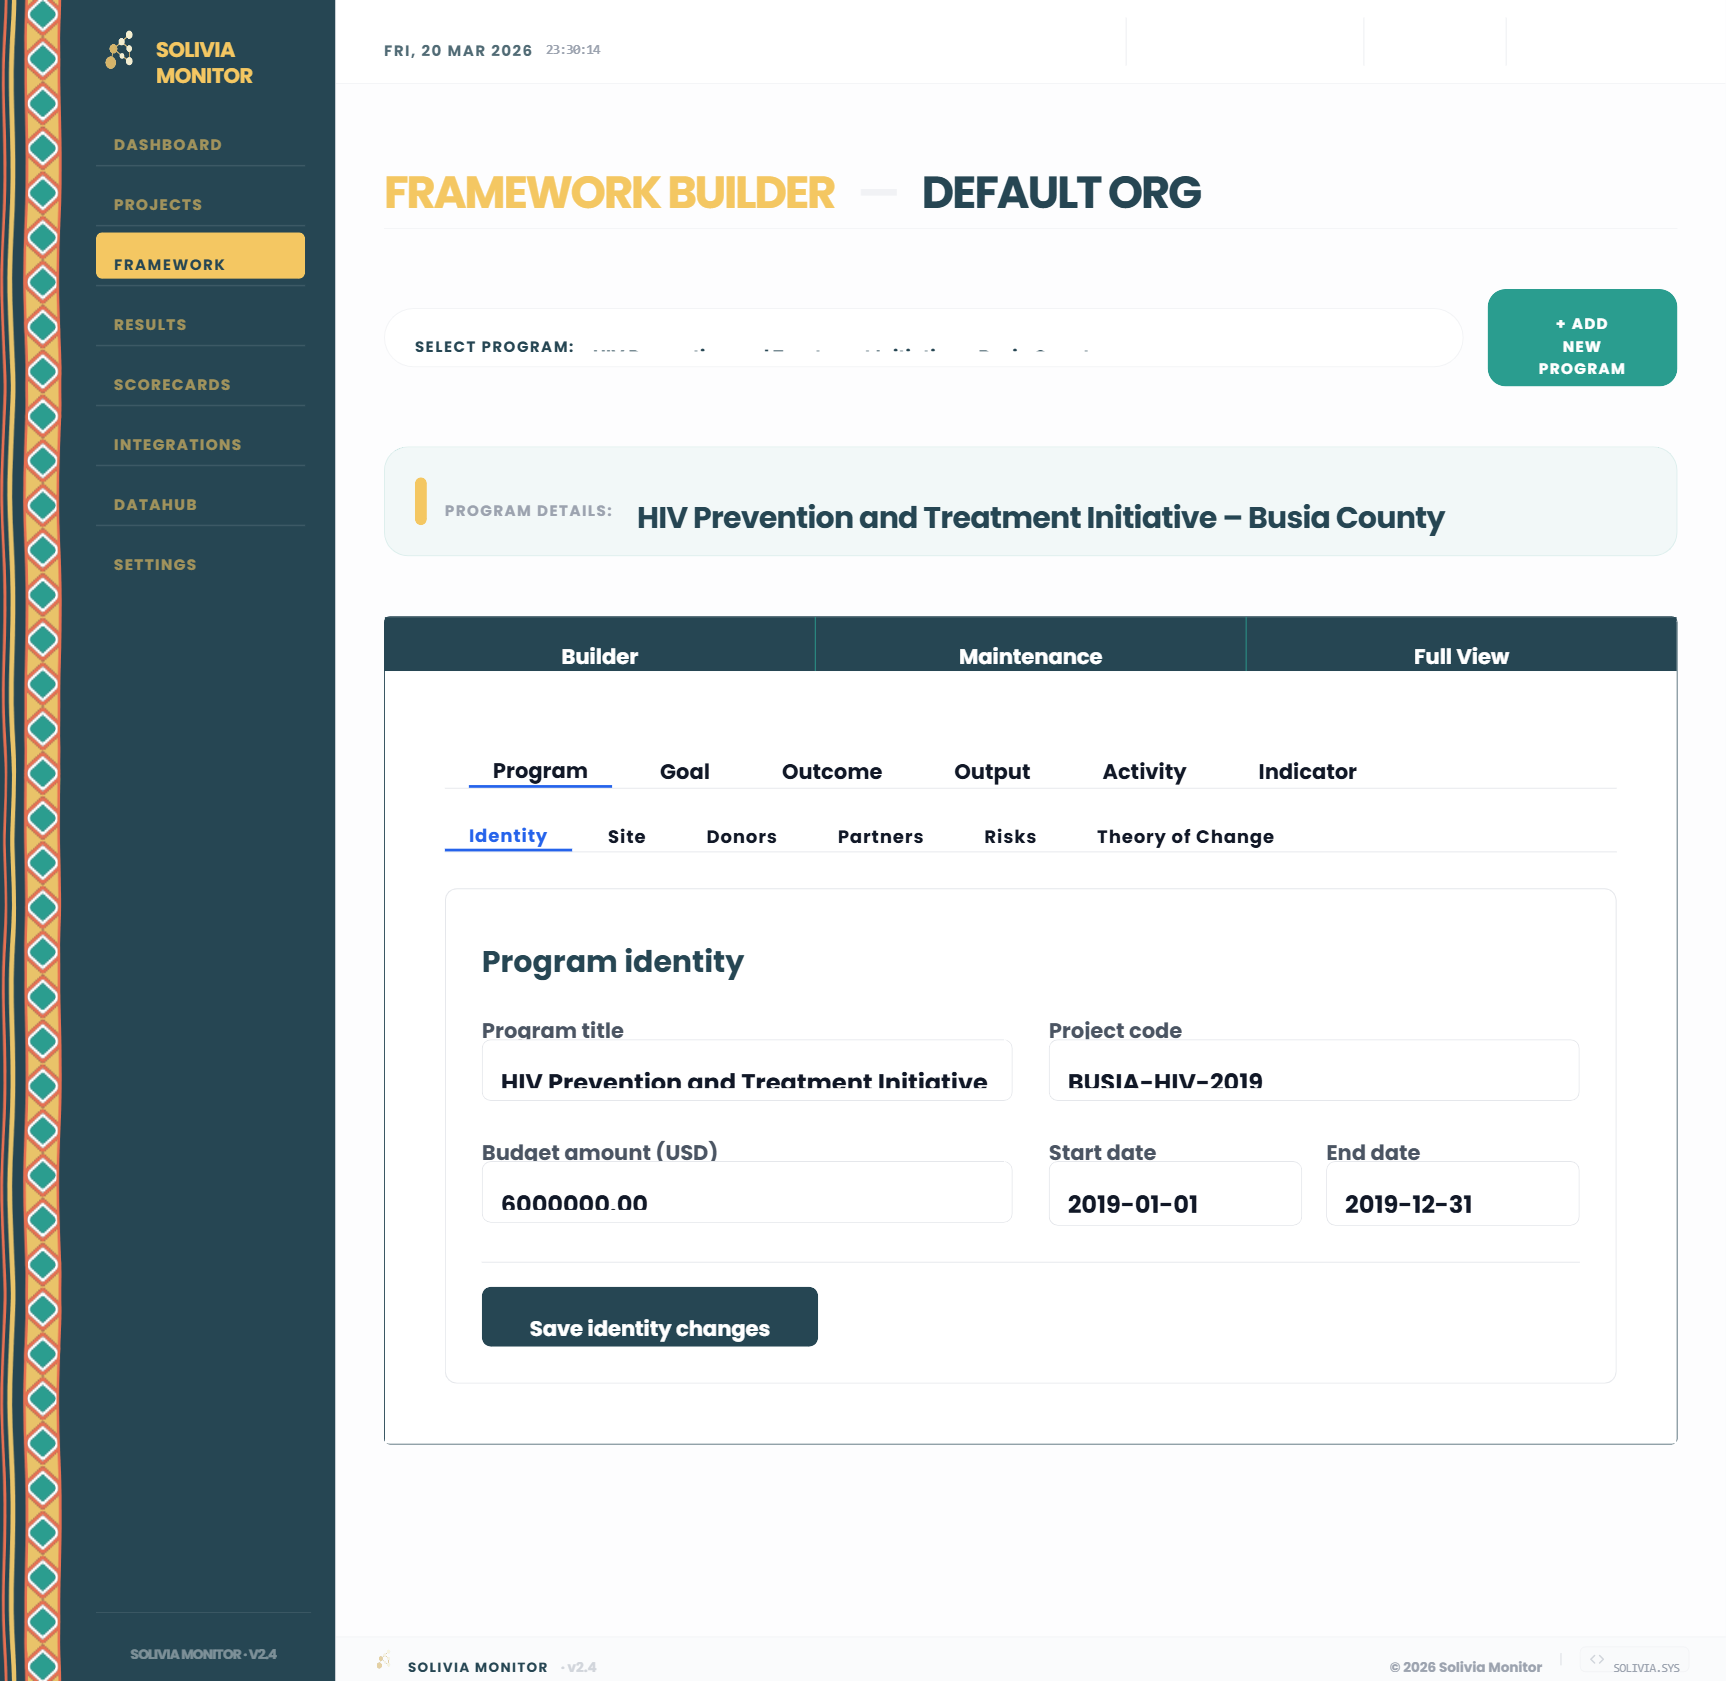
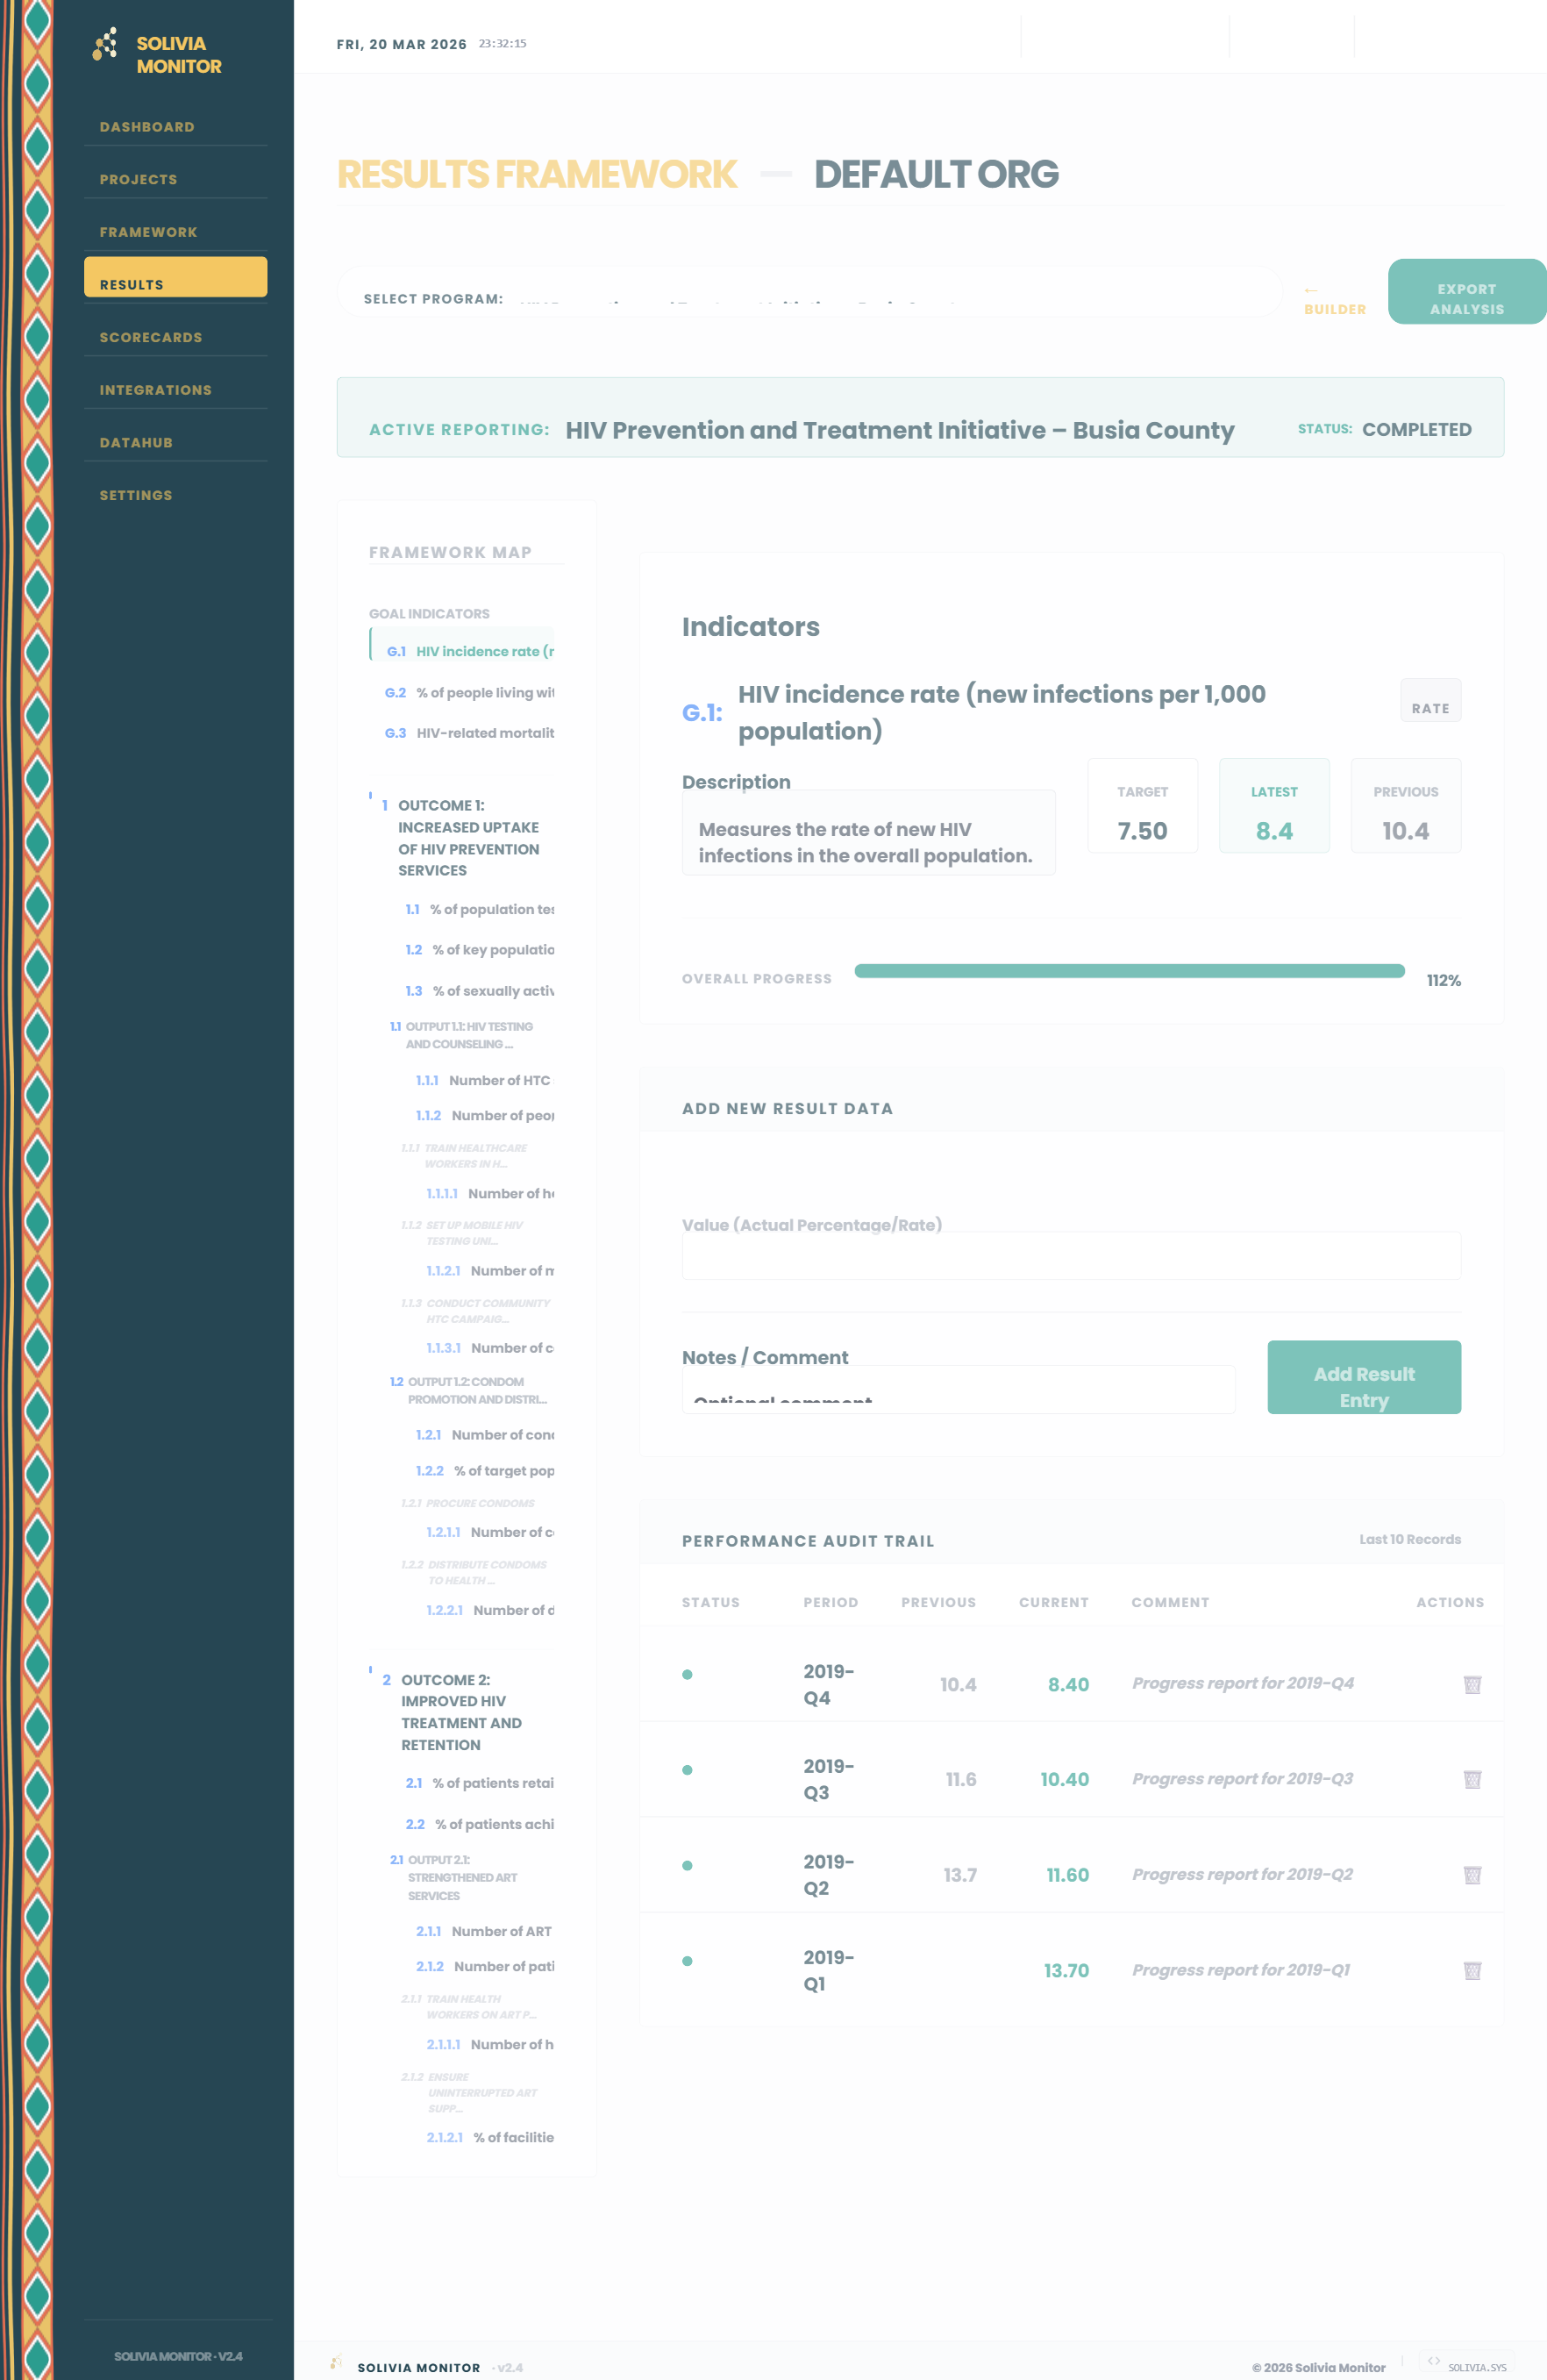
Built for purpose. Solivia Monitor integrates programmatic oversight, data collection, and institutional reporting into a single, high-fidelity environment.

No silos.
No broken pipelines.
No unnecessary complexity.

A platform designed for clarity, efficiency, and control.

MNE Dashboard
Solivia Logo

Client Login

Access your MNE Dashboard

Don't have an account? Request a demo

The reality of M&E today

Across the development and humanitarian sector, common challenges persist:

Fragmented
Data

Scattered across multiple disconnected tools.

Isolated
Indicators

Managed in entirely separate systems.

Painful
Reporting

Manual, time-intensive, and prone to errors.

Costly
Platforms

Rigid software incredibly difficult to adopt.

The result is a fragmented workflow where significant time is spent managing systems instead of managing impact.

!

This is not a gap in effort.
It is a gap in system design.

It is not a generic platform.
It is a purpose-built response.

Built explicitly addressing the structural challenges faced in programme design, tracking, and reporting workflows.

Why Solivia Monitor?

Solivia Monitor was developed from direct, hands-on experience deeply situated within day-to-day Monitoring & Evaluation environments.

The system reflects an understanding of:

  • Operational silos
  • Reporting pressure
  • Fragmented data ecosystems

A unified system for M&E

Solivia Monitor connects all core components of the M&E workflow. All processes operate within a single, integrated environment.

No duplication
No fragmentation
No data loss
01
Pattern

Manage
portfolios

A central hub for managing the entire programmatic portfolio. Track project milestones, financials, donor contributions, risks, and beneficiary data across all active implementations in real-time.

Overview

Programme summary, stage/status badges, progress bars, and budget.

Milestones

The interactive Gantt chart tracking output-level activities and their statuses.

Financials

Donut charts for Funding vs Budget and Burn Rate, plus ledger tables.

Partners

Donor contribution progress, type distributions, and partner tables.

Beneficiaries

Direct/indirect targets, hierarchical location drill-down, and interactive map.

Risks

The programme's risk register detailing likelihood, impact, and mitigation owners.

Theory of Change

Causal logic builder displaying the "IF WE → THEN WE" linked cards and rationales.

Team

The list of platform users assigned specifically to run that programme.

Project Registry
Zoom
Click
Project Overview
Zoom
Click
Beneficiary Data
Zoom
Click
02
Pattern

Track
indicators

Build and maintain the logical hierarchy of programmes. Seamlessly link Goals to Outcomes, Outputs, and Activities to construct the Theory of Change, and configure the rules for all programmatic indicators.

Tab: Builder

The primary interface for constructing the programme's Theory of Change architecture. Elements are created and arranged in a nested, expandable hierarchy.

Tab: Maintenance (Config Engine)

Acts as the core configuration engine for the programme. Data registered here drives modules, dropdowns, and calculations across the rest of the system via its sub-tabs:

Program Context

Configures identity, beneficiary targets, financial donors, partners, risks, and ToC links.

Goals & Outcomes

Registers the overarching objectives and the expected strategic result areas.

Outputs & Activities

Defines deliverables and specific intervention milestones with start/end duration dates.

Indicators Engine

Comprehensive setup for measurement rules, disaggregations, baselines, and targets.

Tab: Full View

A read-only, top-down representation of the complete programme architecture in a single scrollable layout, intended for programme integrity review and stakeholder reporting.

Framework Architecture
Zoom
Click
Builder
Zoom
Click
Maintenance
Zoom
Click
03
Pattern

Measure
impact

Measure actual results against planned targets. Use the Results module for streamlined periodic data entry, and rely on the automated Scorecards to instantly calculate variances and visualize overall programme performance.

Results Data Entry

Framework Map

Sticky hierarchical navigation tree (Goal → Outcome → Output) maintaining context.

Data Submission

Record specific numeric actuals against periods and attach narrative variance notes.

Identity Panel

Live visual progress bars computing latest cumulative achievement vs target.

Audit Ledgers

A 10-record history trail for tracking periodic updates and manual reversals.

Automated Scorecards

Distribution KPIs

Doughnut charts visualizing Green, Amber, and Red programmatic health metrics.

Reach Analytics

Aggregated measurements of total active indicators and overall target reach %.

Grouped Ledgers

Comprehensive tables organizing performance structurally by Outcome and Output.

Autonomic RAG

Programmatically computed status variance formulas requiring zero manual entry.

Results Tracking
Zoom
Click
Scorecard
Zoom
Click
04
Pattern

Connect
systems

Centralise all programmatic knowledge in one secure place. Organise datasets and narrative reports, and seamlessly sync data directly from external collection platforms like KoboToolbox, DHIS2, and SharePoint.

Central DataHub

Dataset Registry

Secure vault for storing and querying indexed tabular metadata files.

Narrative Reports

Archive for internal, donor, and final progress reporting narratives.

Document Vault

Organizational drive for operational PDFs and structural logic files.

External Integrations

Service Ecosystem

Marketplace pipelines interfacing with KoboToolbox, DHIS2, and SharePoint.

System Cards

Live telemetry displaying total synced data points and CRON schedules.

Bulk Importer

Upload mathematically formatted indicator data en masse via CSV grids.

Polling Logs

Immutable 30-day historical ledger detailing API payloads and outcomes.

Datahub
Zoom
Click
Integrations
Zoom
Click
05
Pattern

Govern
access

Manage the organisation's environment and settings. Control global configurations like default currencies, enforce role-based team access, and securely provision API keys for external integrations.

05
Admin · Team · API · Settings
Settings Interface
Zoom

Get started

Simplify Monitoring & Evaluation workflows with a system designed for clarity and performance.

Provisioning...

04:00

We are setting up your custom environment. This will take exactly 4 minutes. Please do not close this tab.

System Ready!

Your organization has been successfully provisioned.

Launch Dashboard →